Income and on-demand transit: Diversity data gap
In this second article of our two-part series, we use data from our ongoing travel surveys to explore how income fits within the larger ‘diversity data gap’.

In the first part of this blog series, we explored the intricate links between the travel choices people make when using on-demand transit and their income.
We now turn our attention to the ‘diversity data gap’, which describes the missing information that is (not) collected about marginalized groups. As one of the key influences on how people can afford to travel, income sits at the heart of the diversity data gap.
But people aren’t just defined by their income; there is diversity in gender, age, ethnicity, disability, and much more. The overlap between all these individual characteristics – a concept known as intersectionality – is central to our understanding of what makes our riders tick, and how to improve the experience for as many groups as possible.
Only when we collect the right data, at a granular enough level to represent diversity in a meaningful way, can we design truly equitable transit. So we asked all our North American survey respondents to anonymously disclose their median household income. We linked their answers to the specific trip they took at the time, and aggregated the data to respect data privacy.
In this blog post, we’ll:
- Explore how income layers onto other forms of socio-economic diversity among our ridership;
- Reveal how on-demand transit prompts new trips to be taken by new rider types;
- Investigate how income affects individual travel behaviours in conjunction with disability.
Diversity data makes the world go round
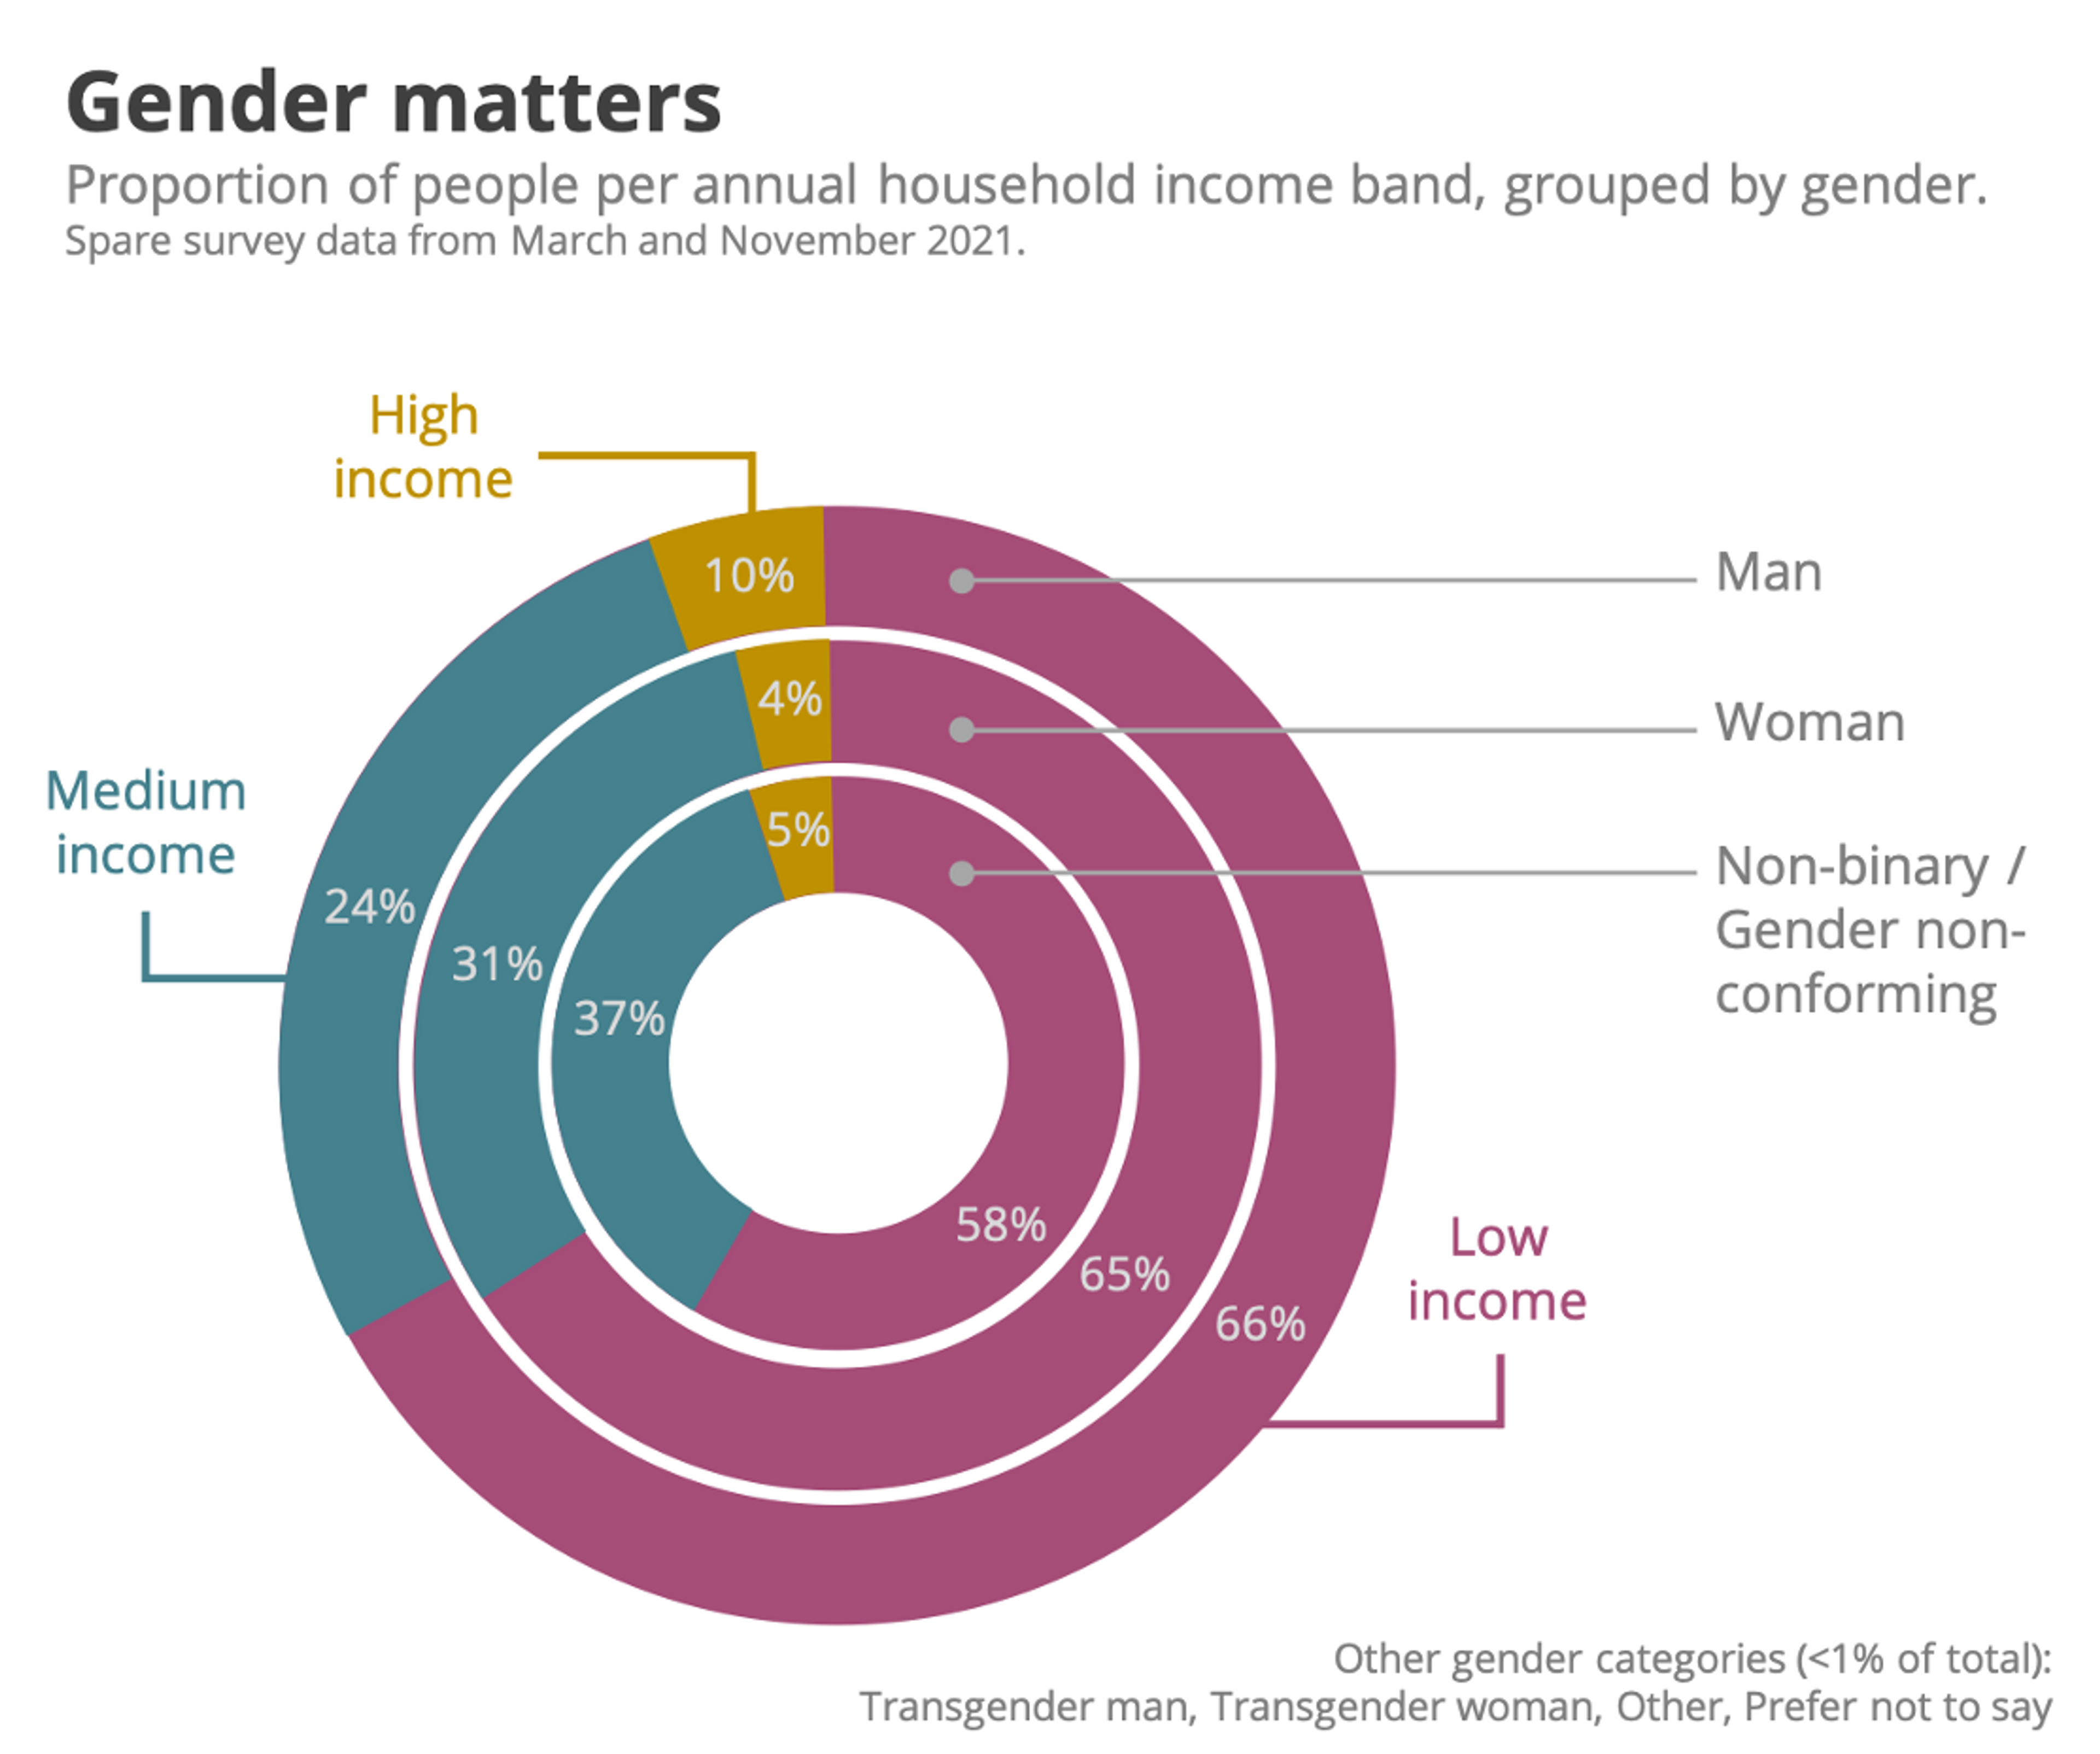
One of the most striking forms of social inequity is that between men and women. Gender and income are intertwined issues, especially in the realm of mobility, where women are more exposed to travel costs than men.
Our data suggests there is a roughly equal proportion of low-income men and low-income women who ride Spare services. However, men who ride are proportionally twice as likely to be high-income than women. Of the 1% of respondents who reported being non-binary or gender non-conforming, a smaller proportion were low-income compared with men and women.
These findings could influence how our agency partners choose to price their on-demand services, and how to structure any promotional or affordability programs.
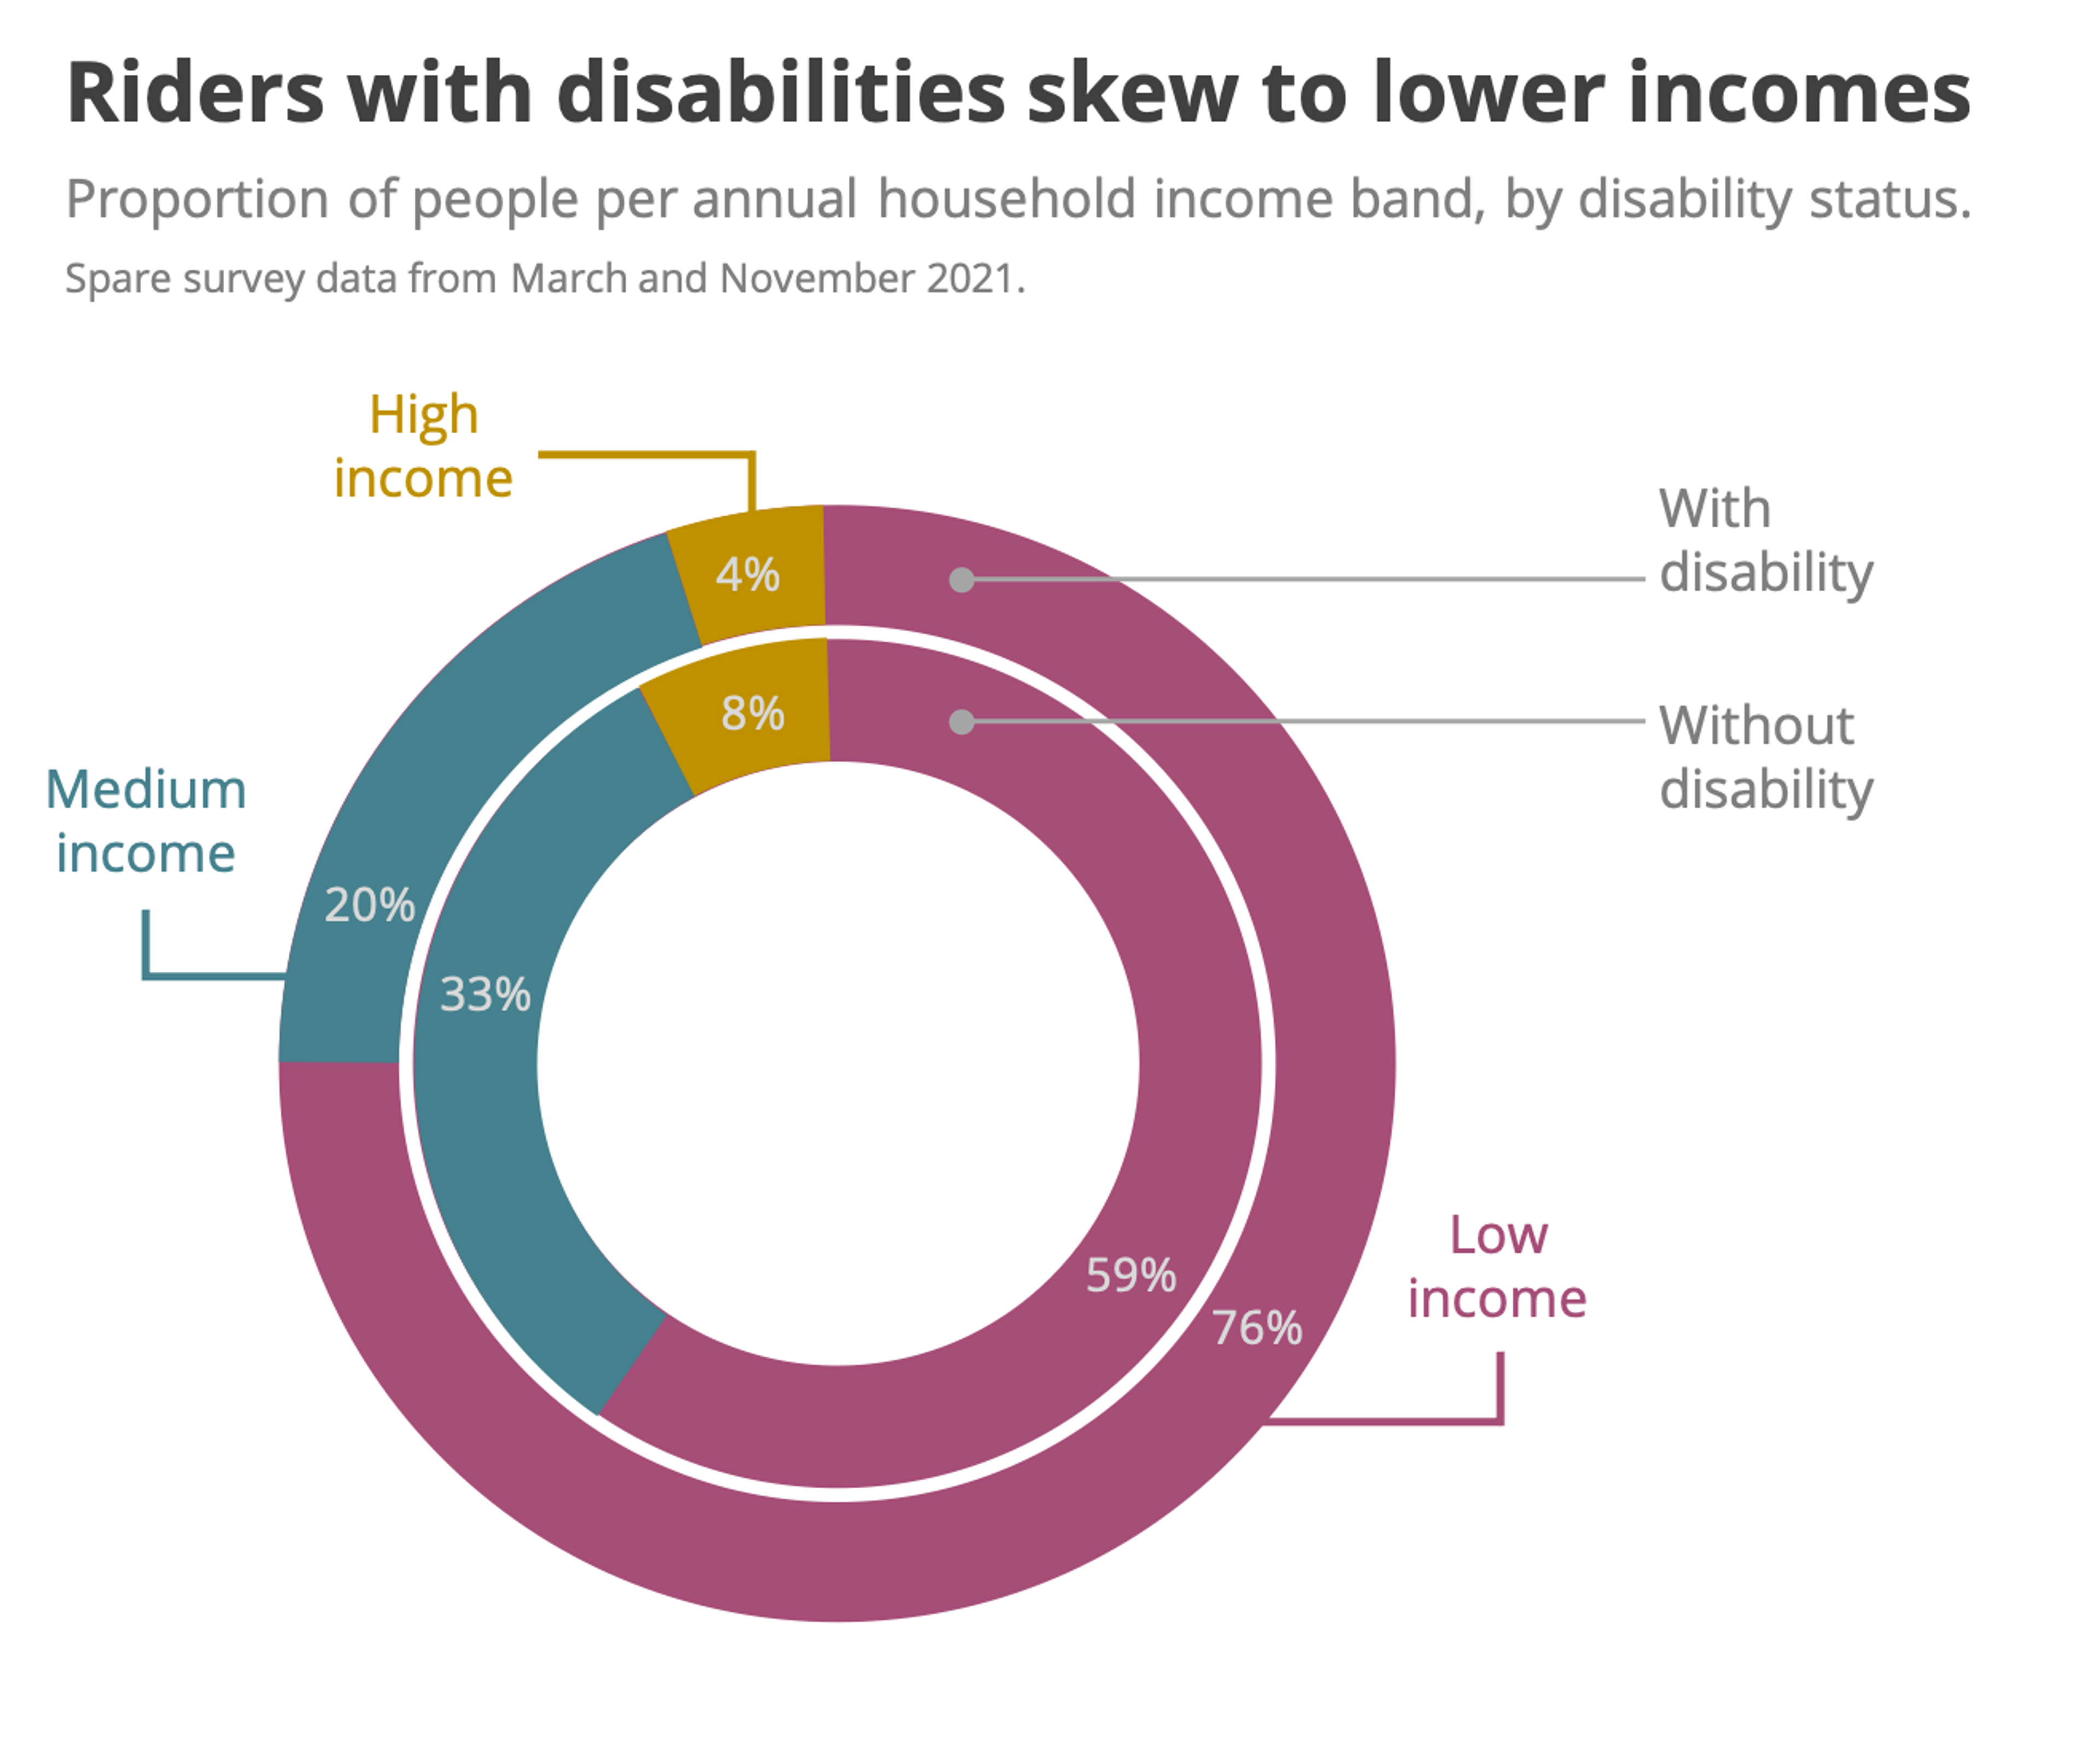
Across all our survey datasets, 28% of our respondents identified with having at least one disability. This is slightly higher than the general disability prevalence in the US, which stands at 26%. Among our respondents, riders with disabilities were 14% more likely to be low-income than riders without disabilities, suggesting that Spare’s on-demand services are providing convenient, accessible transportation to some of society’s most vulnerable populations.
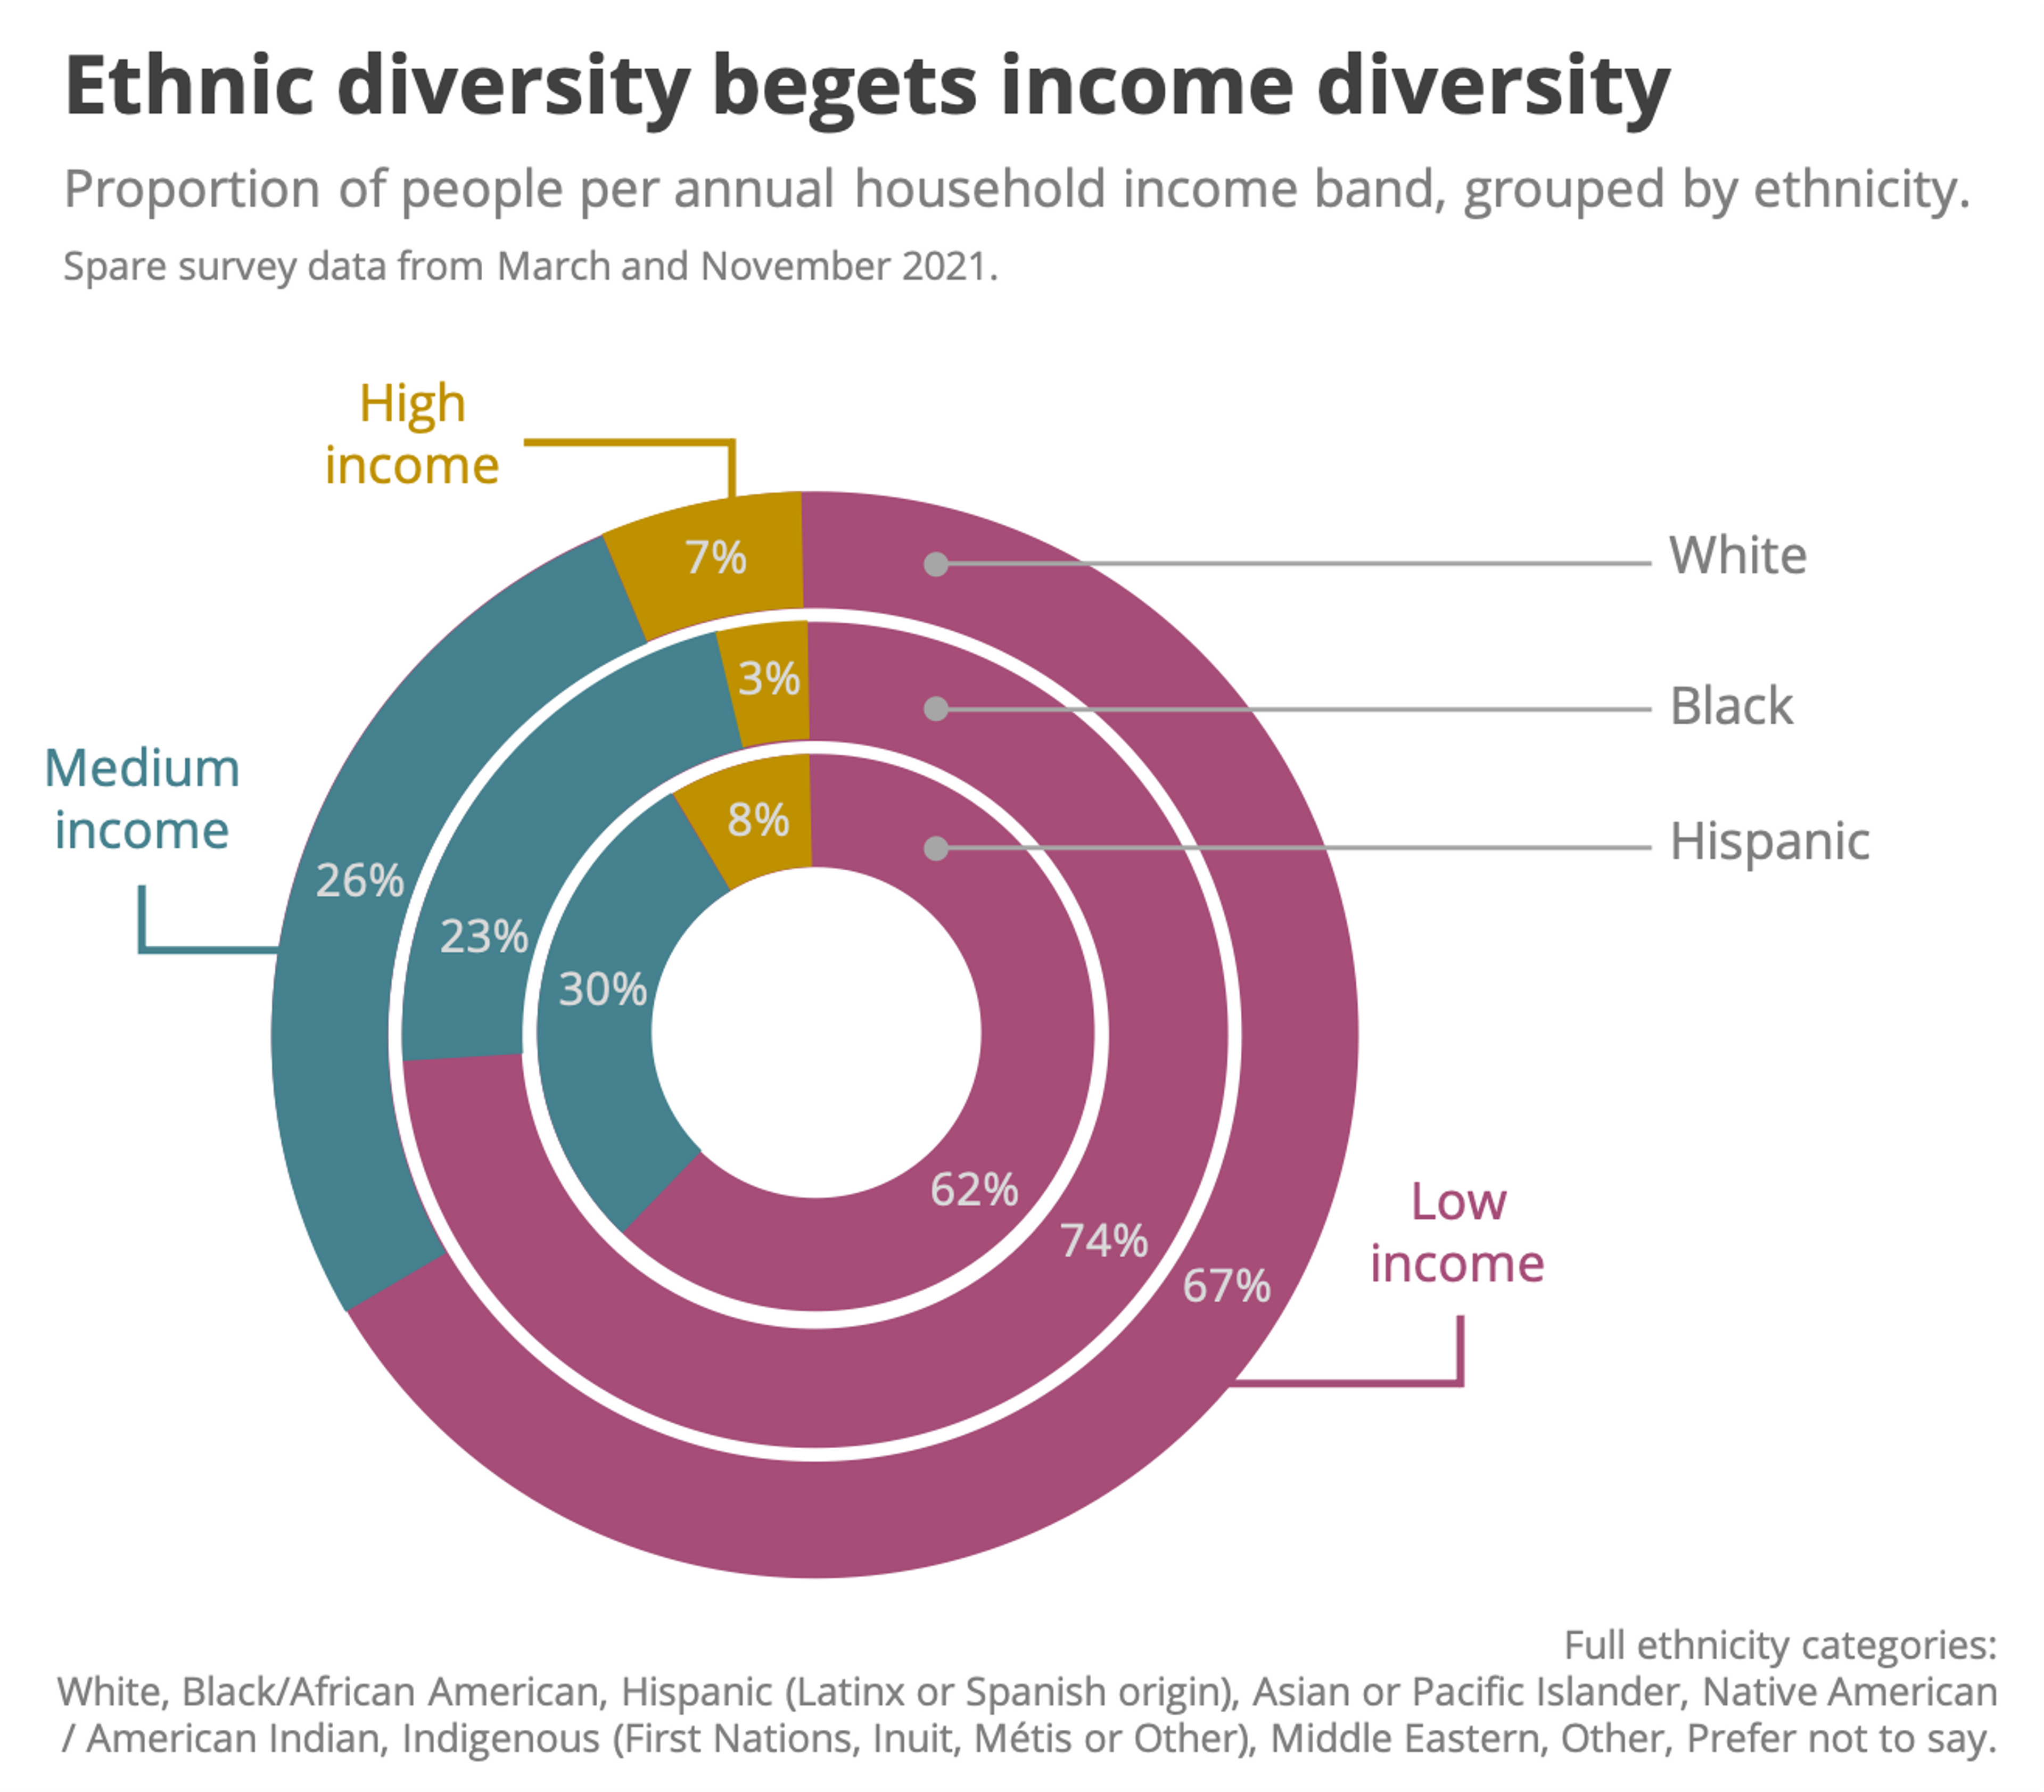
Ethnicity is another important component of intersectionality. White, Black/African American and Hispanic riders made up over 75% of our respondents, and there are important income disparities between these three groups. Almost three quarters of Black riders are low-income, and only 3% are high-income. In contrast, Hispanic riders are almost three times more likely to be high-income, and less than two thirds are low-income.
It’s an important reminder that when we plan on-demand mobility services with specific ethnic inequities in mind, we should also consider the unique income distributions within ethnic groups, because income impacts riders’ ability or desire to engage with on-demand transit.
New trips for new riders
Whenever on-demand transit is introduced in a neighborhood, it tends to generate new trips among people who would otherwise never have had the opportunity to travel. In our first blog post, we showed how these ‘induced trips’ are twice as common among low-income people as among medium- and high-income people.
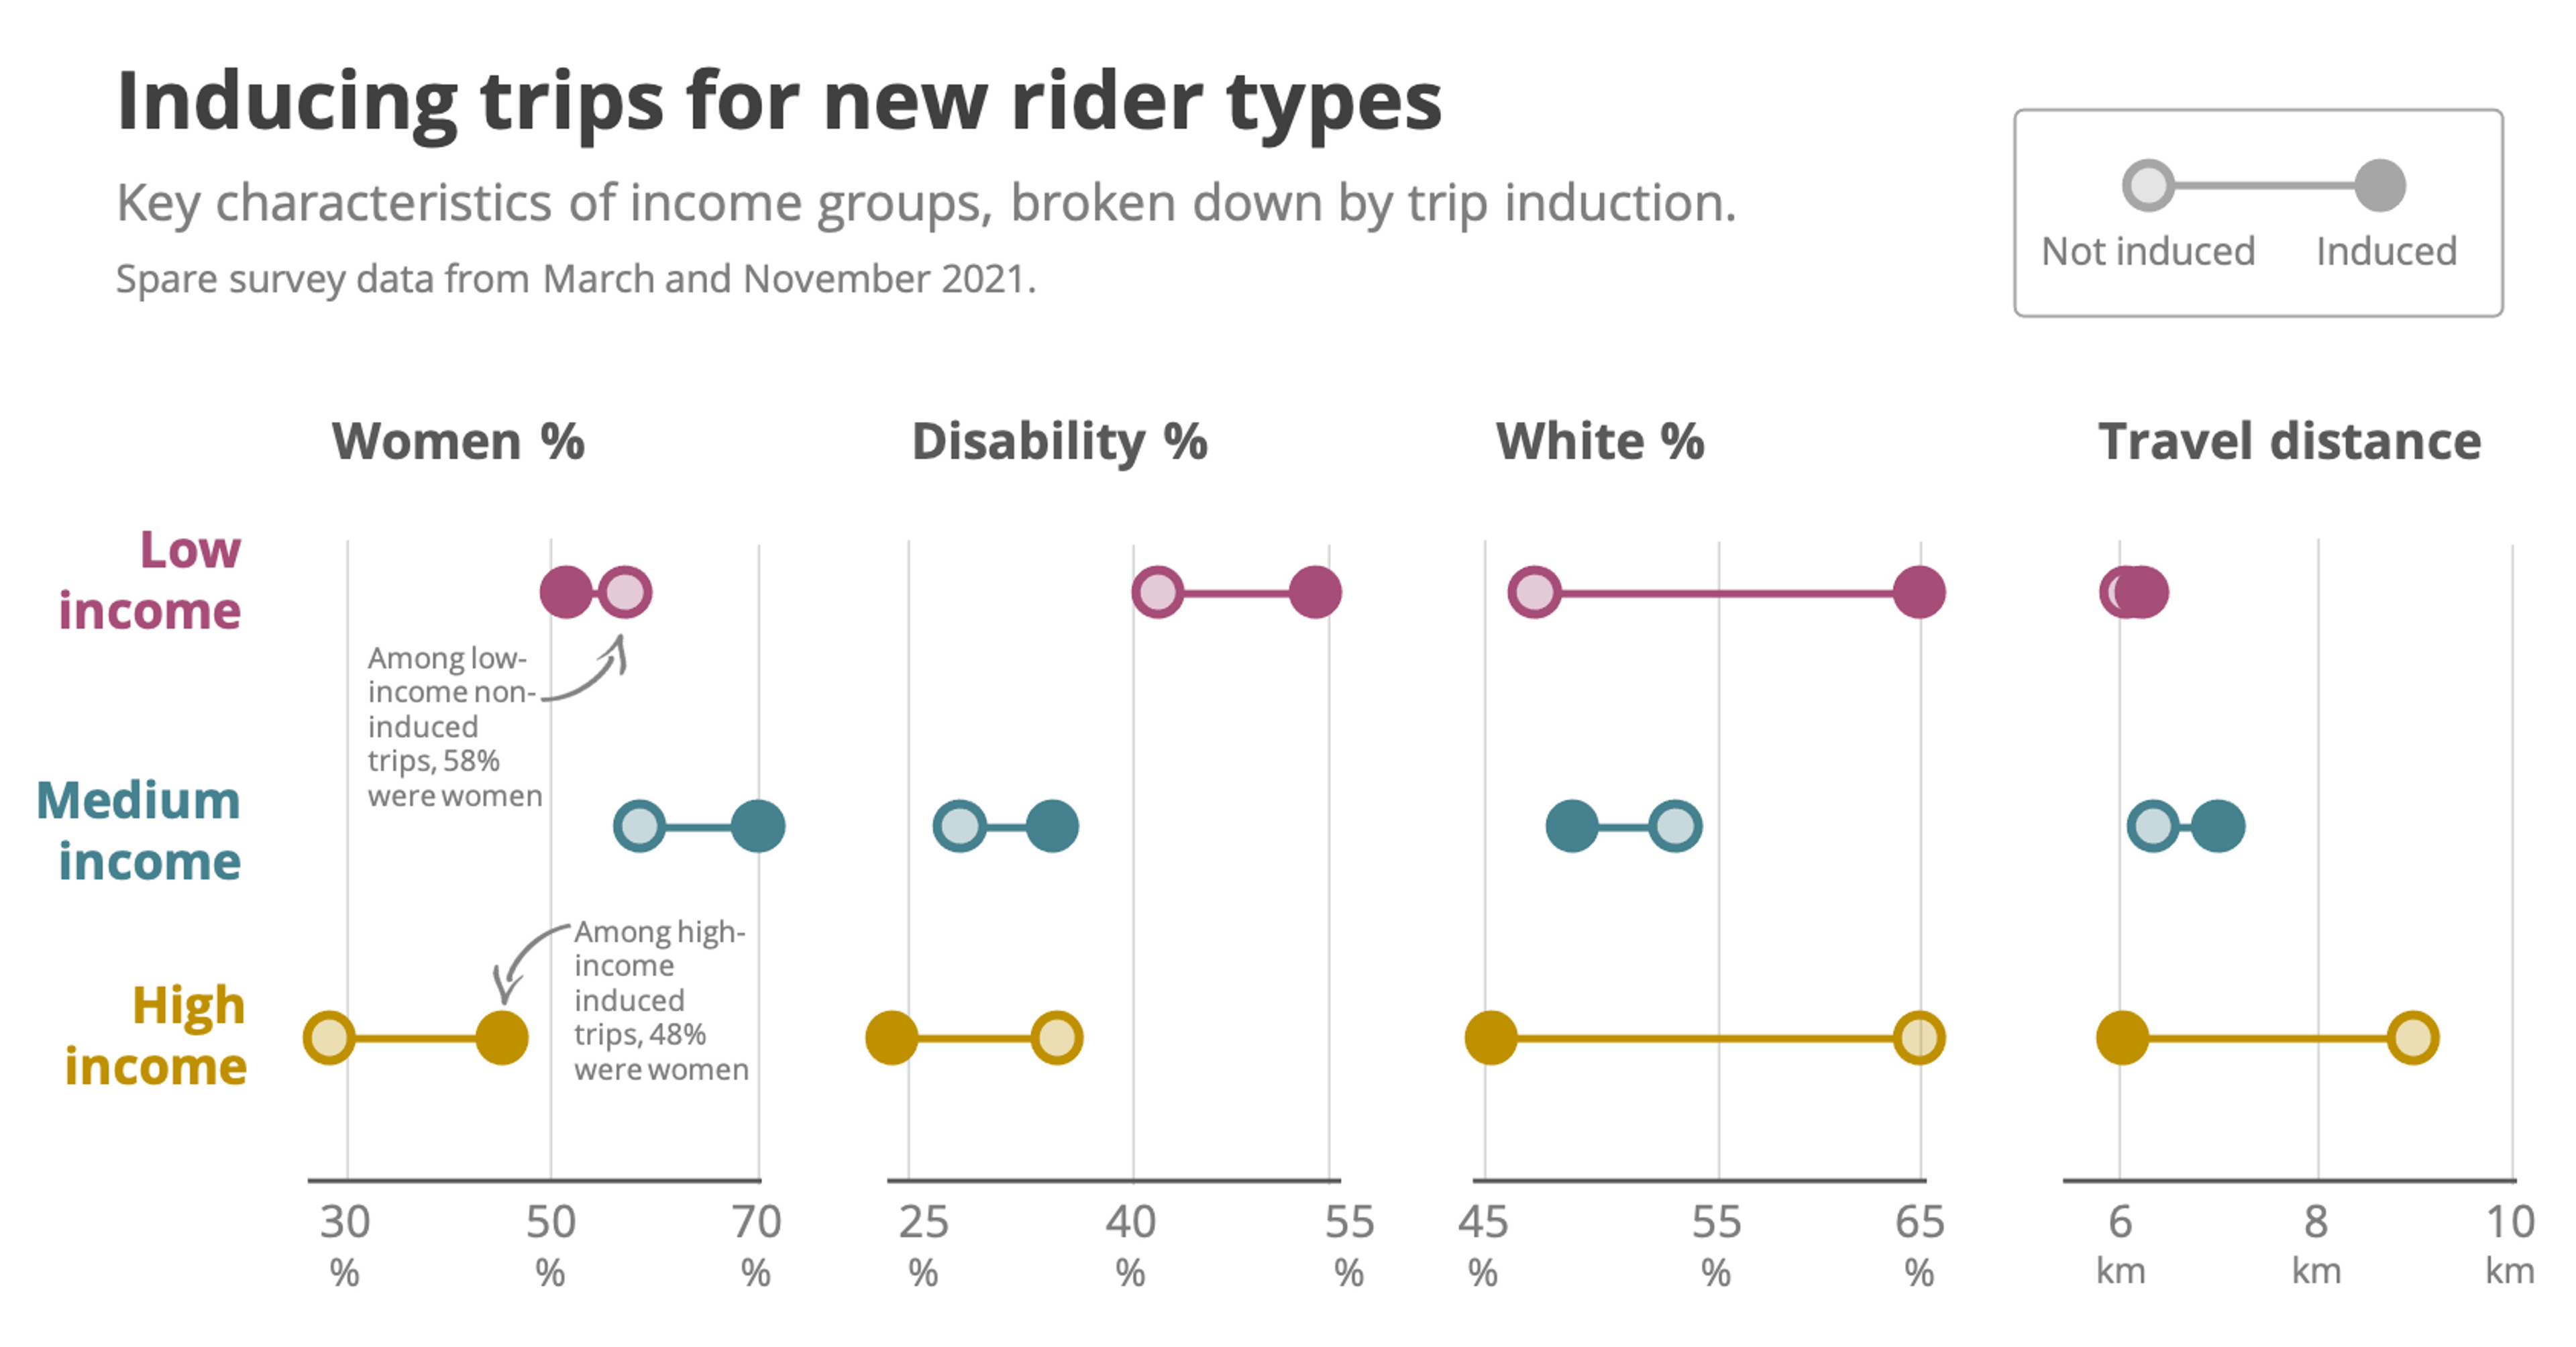
To better understand who is benefiting most from induced trips, we disaggregated our mode split data by gender, disability and ethnicity. We used the proportion of women, the disability prevalence, and the proportion of White riders as indicators of diversity for this exercise.
We found that a similar proportion of induced trips are taken by low-income women compared with non-induced trips. In contrast, among high-income riders, induced trips are almost twice as likely to be taken by women compared with non-induced trips. This suggests that, proportionally speaking, our services are encouraging new trips more often among high-income women than other groups. This may or may not be the intention of a given service, so it’s important to be aware of this.
When it comes to disability, a greater proportion of low-income riders report having a disability if their trip is induced compared to not induced; the opposite is true for high-income riders. There is good news here, because it means some of the most marginalized people in society – low-income people with disabilities – are being empowered to take trips they would never have had the opportunity to take. However, we are simultaneously prompting new trips to be taken by high-income people with fewer disabilities, presumably because of the convenience of on-demand transit. This may run counter to the goals of our agency partners.
A stark pattern emerges for ethnicity. We find that, among low-income riders, the proportion of White riders was 20% higher for induced trips than non-induced trips. This pattern is reversed among high-income riders. Like for disability, this has multi-faceted implications for transportation equity: on-demand transit is enabling new trips to occur among high-income ethnic minorities, all the while boosting low-income White ridership.
It’s also worth noting how difficult it might be to service the new trips that are being induced. A simple proxy for this is the travel distance of a trip. There is almost no difference in the distance traveled for induced and non-induced trips among low-income riders, meaning there is no direct impact from trip induction except for additional trip volumes. In contrast, induced trips among high-income riders are on average 3 km shorter than non-induced trips. This has important implications for the size and number of vehicles that should be supplied to transit zones serving high-income residents or workers.
Income dictates why you travel – and when
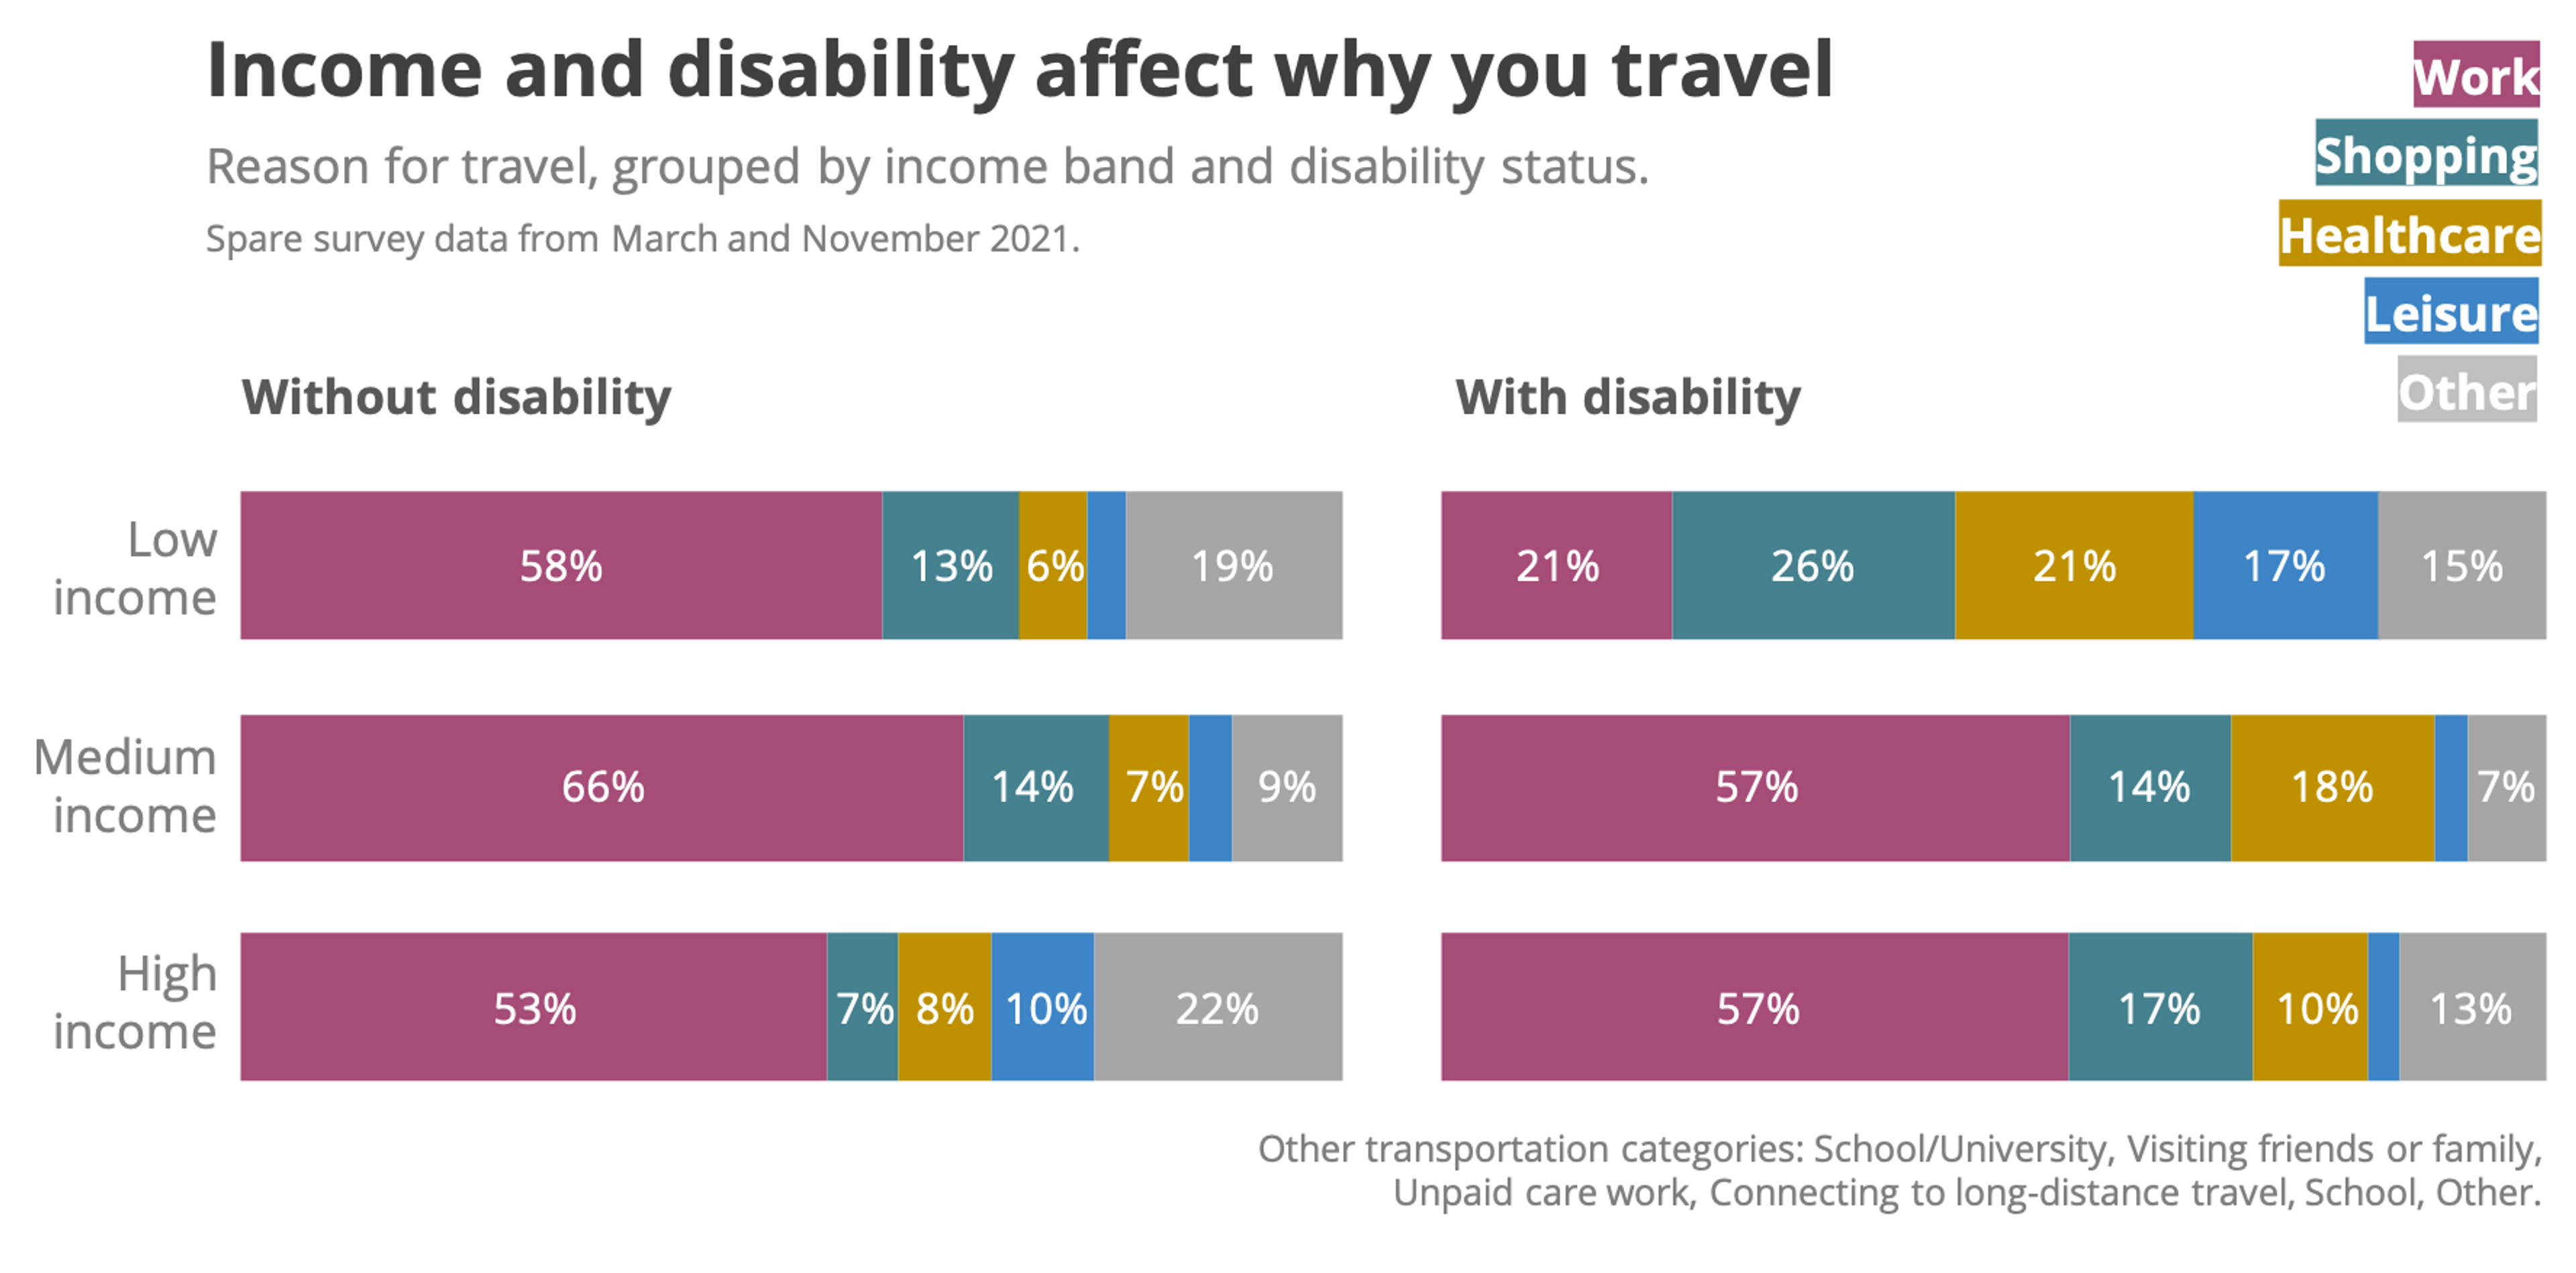
Next, we turn our attention to why riders travel – and how this is impacted by both income and disability status. Across our surveys, 28% of riders reported having a disability, which is similar to the disability prevalence of the general US population. To simplify things, we focus on the four most common trip types stated by our respondents: commuting, shopping, healthcare and leisure/recreation.
We found that disability status has a profound effect on how different income bands travel. Among riders without a disability, the majority of trips across all incomes were work/commuting trips, and all income bands had a fairly similar breakdown of shopping, healthcare and leisure trips. Medium-income riders had the highest commuting rate, while high-income riders had the highest rate of leisure travel.
Among riders with a disability, the patterns are starkly different. While medium- and high-income riders used services mostly for commuting, low-income riders with disabilities had an almost equal split between commuting, shopping, healthcare and leisure. In fact, low-income riders with disabilities had the highest rate of leisure travel of all rider categories.
It’s incredibly important to know why different groups might be wanting to use the service, because it determines the kinds of vehicles that might be needed, or indeed the potential for pooling trips together. For example, if multiple people from a similar social group recurrently attend the same recreational event, there may be a chance to pool rides together in a predictable way, and a transit agency could preempt this by planning appropriate driver shifts to suit this kind of demand.
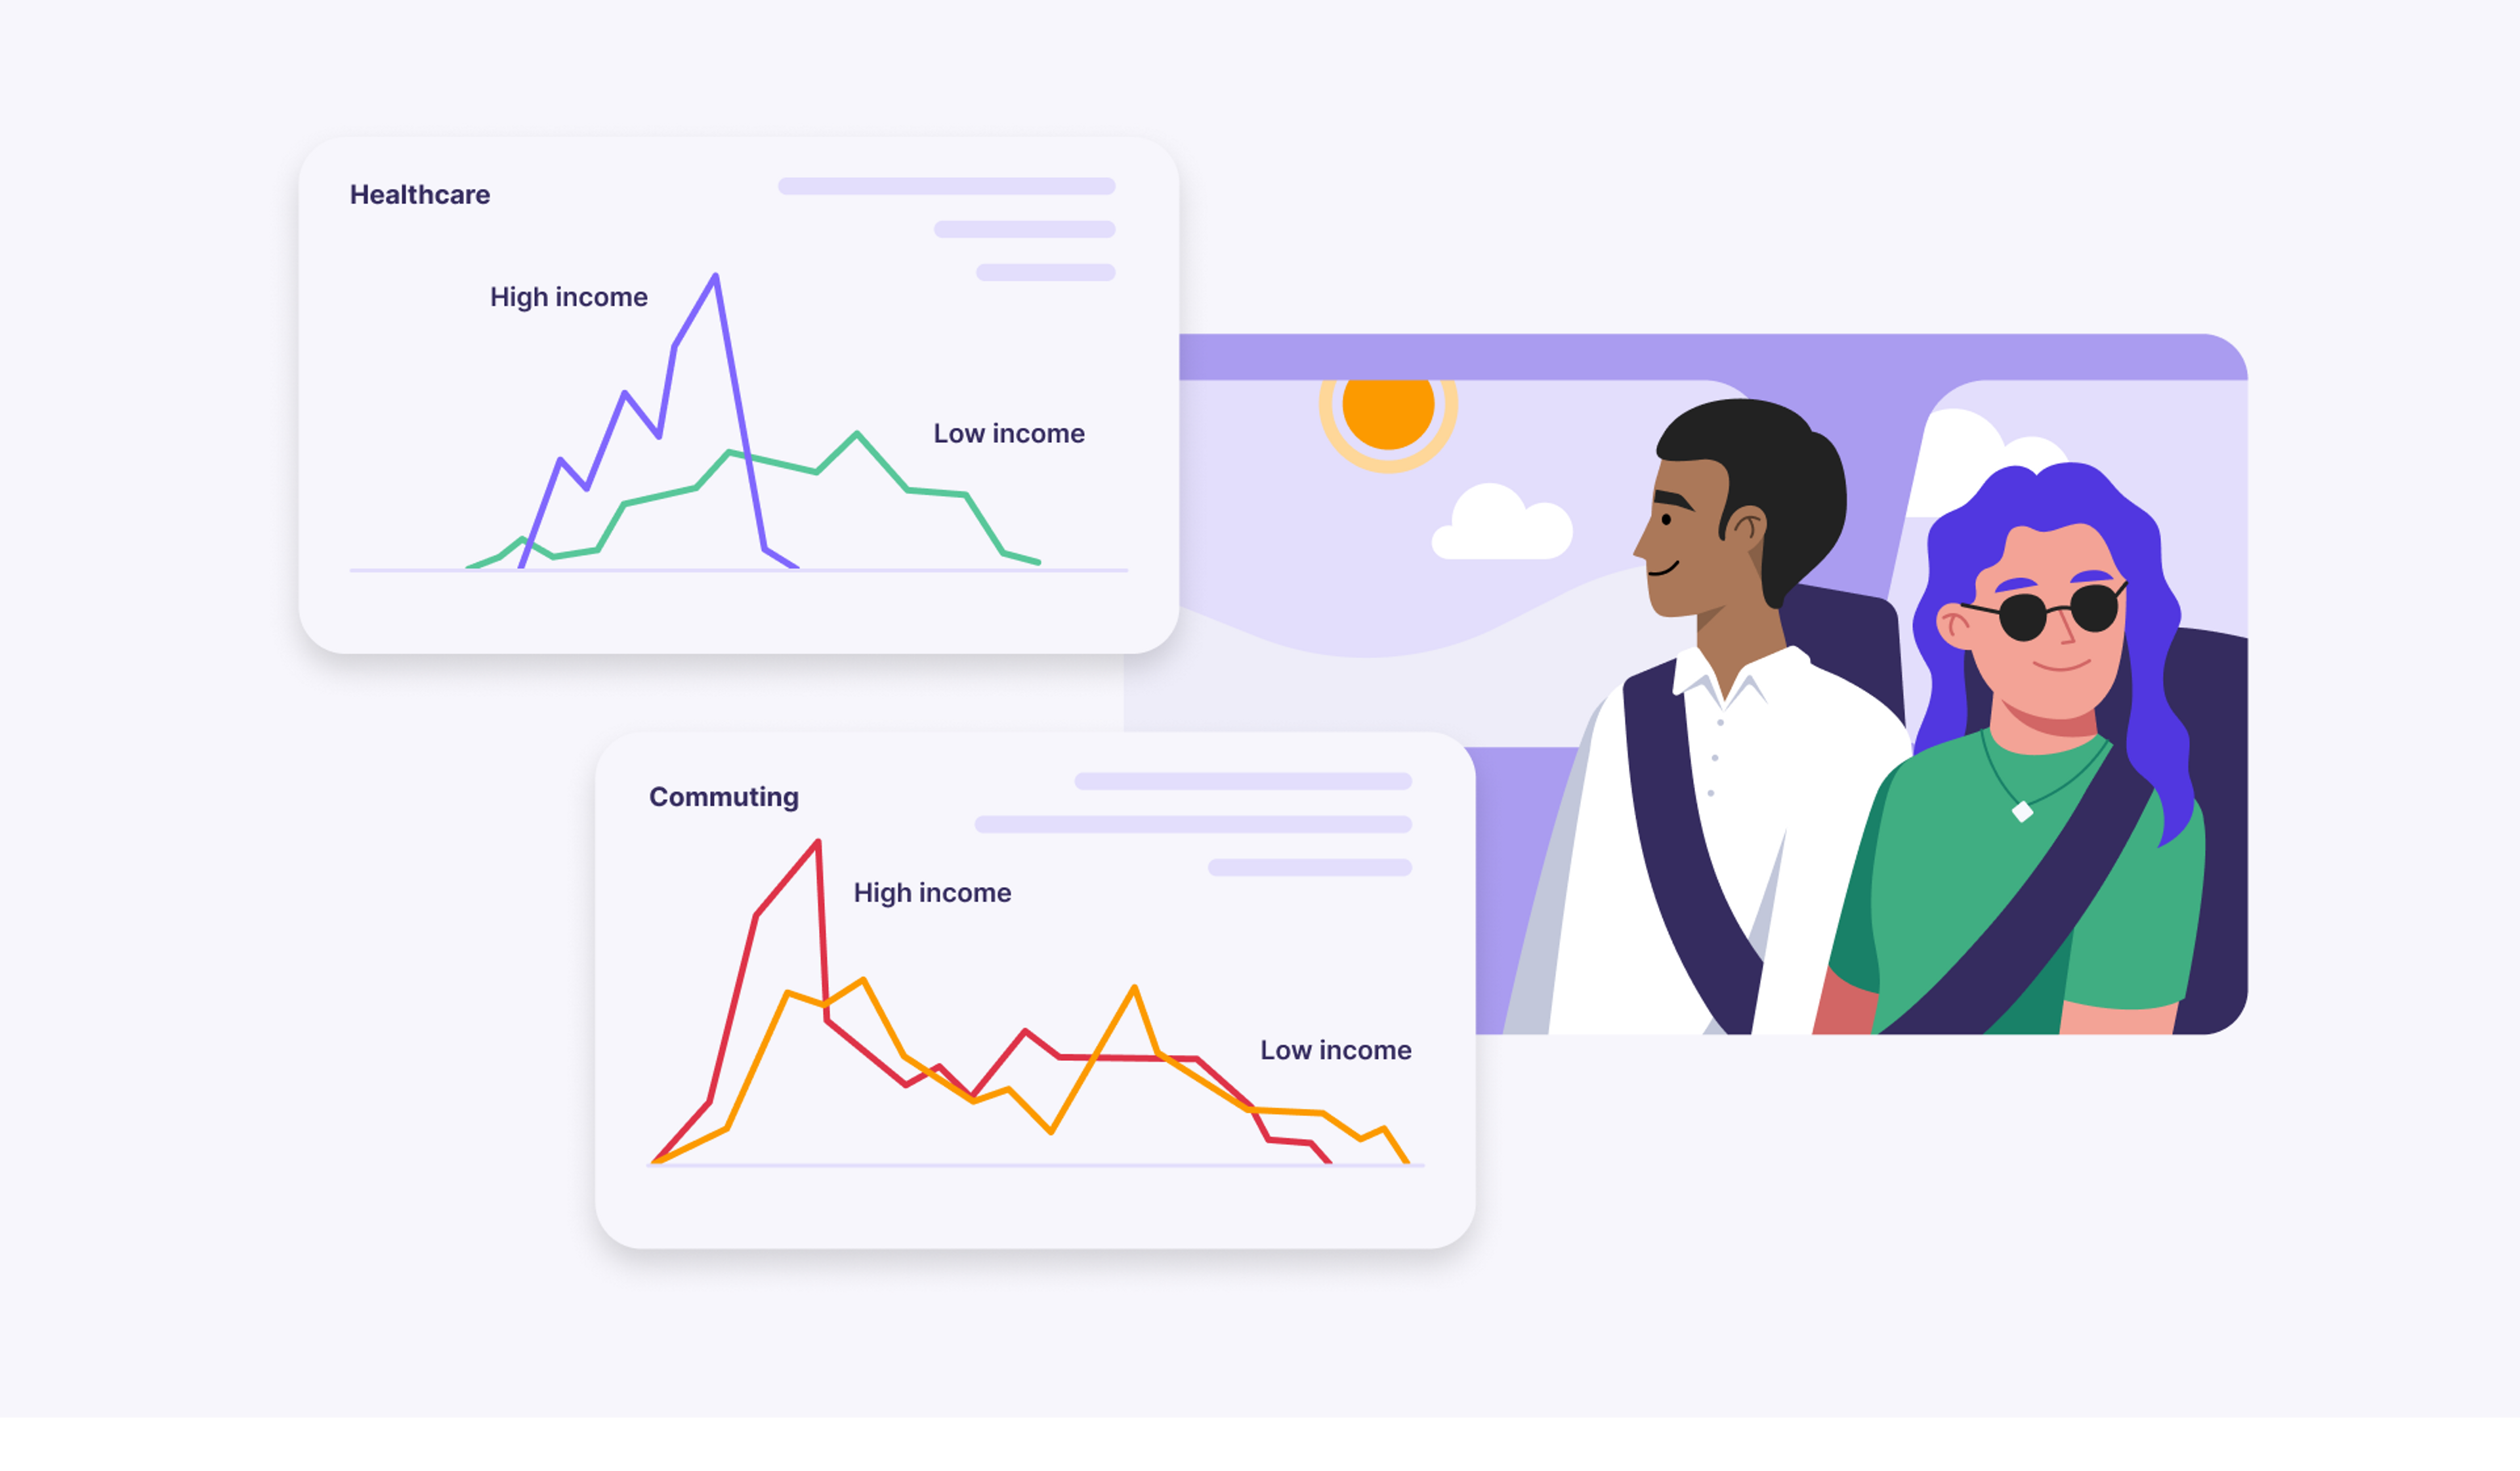
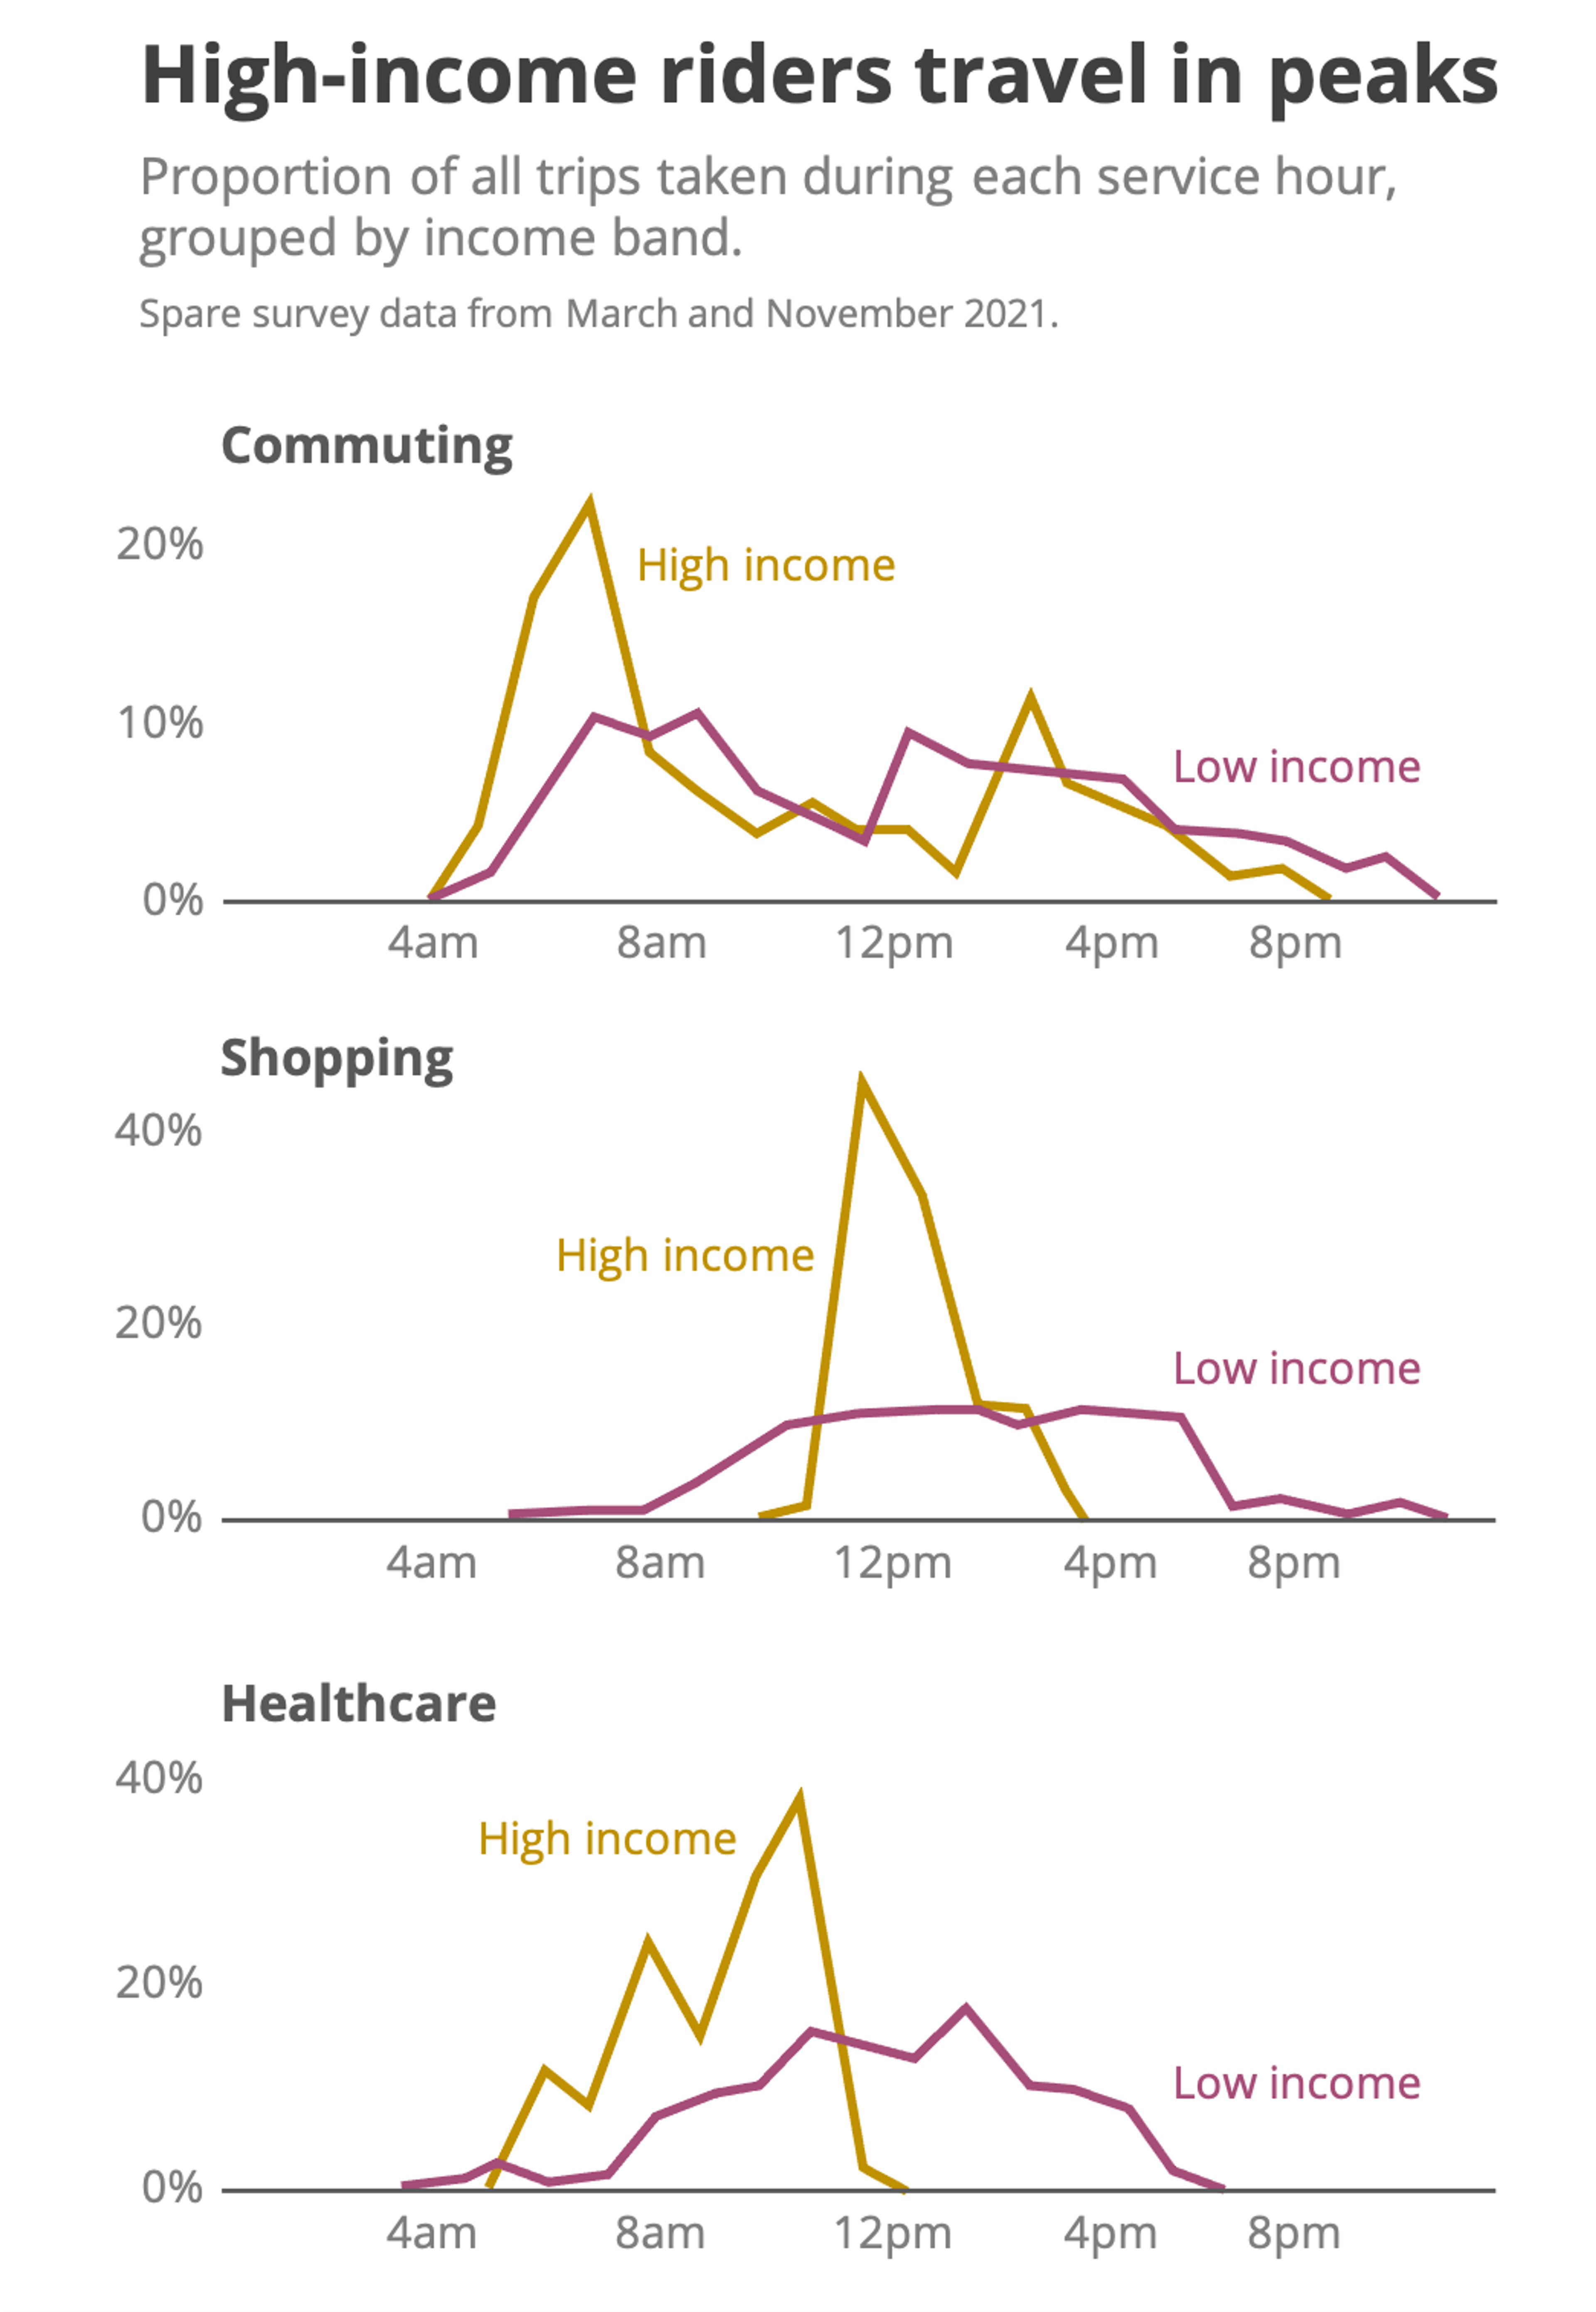
Our trip type data gets more interesting once we examine the time of day at which different income bands travel. Across the three most common trip types, high-income riders tend to travel in a far more ‘peaky’ fashion than low-income riders. For commuting trips, high-income travel is concentrated in the morning and afternoon peaks, whereas for healthcare trips, high-income riders travel only in the mornings. In contrast, low-income riders generally spread their trips far more evenly throughout the day.
These trends, which likely result from constraints associated with the jobs typically performed within different income bands, are an important reminder to plan services according to riders’ needs. The ‘peakiness’ of high-income travel may cause vehicle supply issues, since demand is concentrated in short periods of the day.
In these cases, creative marketing or pricing incentives may be required to spread out that demand among high-income riders. A transit agency with a strong focus on equity could also choose to subsidize trips at times of day that are preferential to low-income riders, such as afternoon trips to shopping and healthcare locations.
Diversity is our strength
The flexible yet affordable nature of on-demand transportation means it has the potential to overhaul transit provision for marginalized communities. In this two-part blog series, we have discovered that low-income groups ride on-demand transit most often, and that a huge proportion of these low-income trips are induced.
What’s more, on-demand transit prompts new trips to be taken by new types of riders, such as riders with disabilities on low incomes, or women on high incomes. However, these kinds of insights can only be revealed when we take an intersectional approach – in other words, we should always consider income alongside other characteristics such as gender, disability and ethnicity.
We highlighted key differences between the ways in which people from different income bands are able to (or choose to) travel. High-income riders travel in much ‘peakier’ ways than low-income riders, and the transportation mode we displace with each on-demand trip depends heavily on the income of the rider.
Most importantly, the service quality a rider experiences seems unrelated to income. While hugely encouraging in some ways, some of our agency partners may actually wish to prioritise marginalized groups, such that low-income riders receive a better service than others. If agencies do have specific goals based on income equity, it is imperative to collect income data regularly and to track related metrics over time.
Through our travel surveys and other datasets, we actively work with our partners to ensure that their equity goals are clearly articulated, understood, and measured. This ensures the on-demand mobility industry continually strives to improve travel for everybody – with a special focus on those who need it most.